Trend Through the Dots
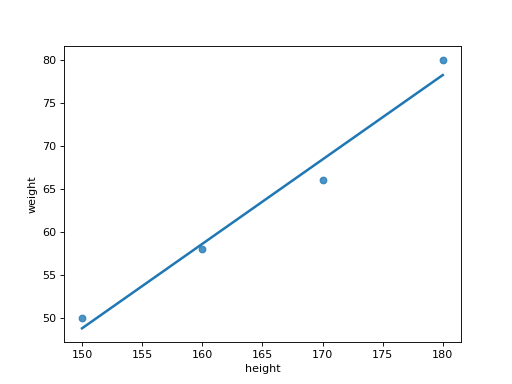
df has columns height and weight. Draw a seaborn scatter plot of weight against height with the least squares line drawn through it, and without the shaded band around the line (ci=None). Draw it on a chart made with fig, ax = plt.subplots() by passing ax=ax, and return the figure.
Checked: the points and the lines.
Example 1
df {"height":[150,160,170,180],"weight":[50,58,66,80]}
draws
Constraints
3 <= len(df) <= 40- The heights are not all equal
Write it in your browser, against the clock. The model solution, stepped through line by line, comes after.
More seaborn problems
- A Chart per GroupMedium
- A Trend per GroupMedium
- Counts in a Chosen OrderMedium
- How the Columns Move TogetherMedium
- Means Joined by LinesMedium
- Pivot Then ColorMedium
- Share Below Each ValueMedium
- Stacked ShapesMedium