Share Below Each Value
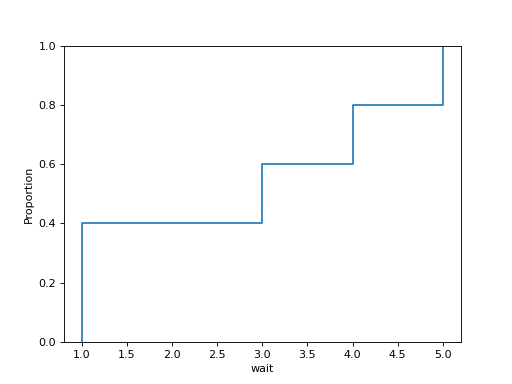
A histogram depends on its bins. The cumulative view does not: for every value it shows the share of the data at or below it, as a staircase from 0 to 1. df has a column wait (minutes). Draw that staircase with seaborn. Use an ax you create and return the figure.
Checked: the lines and the x label.
Example 1
df {"wait":[3,1,4,1,5]}
draws
Constraints
1 <= len(df) <= 60
Write it in your browser, against the clock. The model solution, stepped through line by line, comes after.
More seaborn problems
- Stacked ShapesMedium
- The Average LineMedium
- A Histogram per GroupHard
- A Line per PanelHard
- Bars That Say Their NumberHard
- Bars per PanelHard
- Bars, Curve and MeanHard
- Dots With MarginsHard