The Average Line
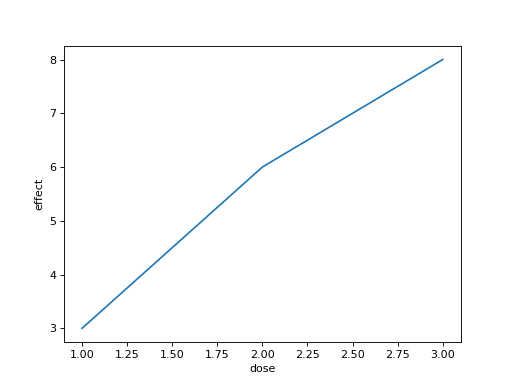
An experiment was repeated several times: df has columns dose and effect, with several rows for each dose. Draw one seaborn line showing the mean effect at each dose, without the shaded band around it (errorbar=None). Use an ax you create and return the figure.
Checked: the lines, the x label and the y label.
Example 1
df {"dose":[1,1,2,2,3,3],"effect":[2,4,5,7,6,10]}
draws
Constraints
- 2 to 8 doses with 2 to 6 rows each
Write it in your browser, against the clock. The model solution, stepped through line by line, comes after.