Bars, Curve and Mean
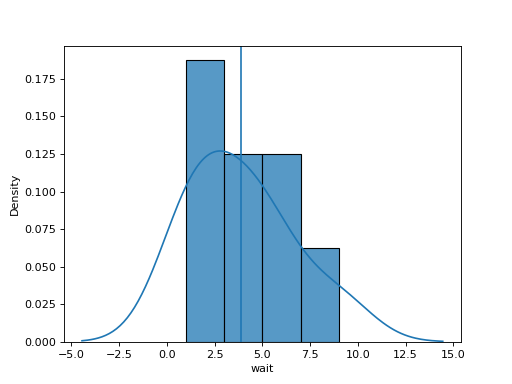
df has a column wait. Build one chart from three layers on the same ax:
1. a seaborn histogram of wait with bins bins, scaled as a density (stat="density"),
2. a seaborn kernel density curve of wait with default settings, a smooth version of the histogram,
3. a vertical line across the chart at the mean of wait.
Return the figure.
Checked: the bars and the lines.
Example 1
df {"wait":[3,1,4,1,5,9,2,6]}
bins 4
draws
Constraints
5 <= len(df) <= 60, values not all equal3 <= bins <= 10
Write it in your browser, against the clock. The model solution, stepped through line by line, comes after.
More seaborn problems
- Dots With MarginsHard
- Every Pair of ColumnsHard
- Months and YearsHard
- A Title for the ChartBeginner
- Average per TeamBeginner
- Boxes per TeamBeginner
- Dots From a TableBeginner
- How Many of EachBeginner