Every Pair of Columns
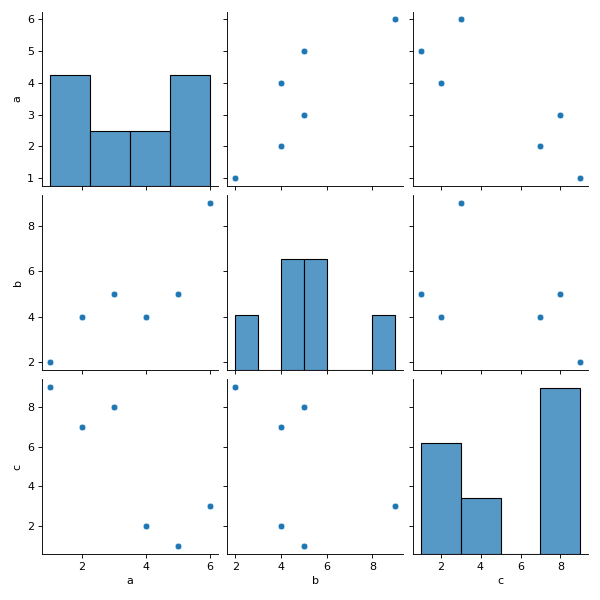
The first look at a new table: df has three numeric columns. Use seaborn's pairplot with its default settings to draw every column against every other as a grid of scatter plots, with a histogram of each column on the diagonal. The function returns a grid object, not a chart: return its figure.
Checked: the points, the bars, the x label and the y label.
Example 1
df {"a":[1,2,3,4,5,6],"b":[2,4,5,4,5,9],"c":[9,7,8,2,1,3]}
draws
Constraints
- 3 columns, 6 to 30 rows, no column constant
Write it in your browser, against the clock. The model solution, stepped through line by line, comes after.
More seaborn problems
- Months and YearsHard
- A Title for the ChartBeginner
- Average per TeamBeginner
- Boxes per TeamBeginner
- Dots From a TableBeginner
- How Many of EachBeginner
- Line From a TableBeginner
- Shape of a ColumnBeginner