Shape of a Column
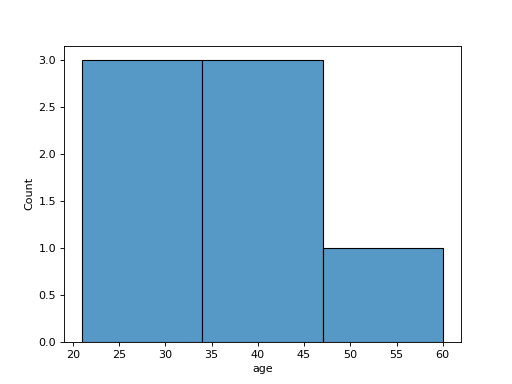
df has a column age. Draw a histogram of it with bins bins, with seaborn. Draw it on a chart made with fig, ax = plt.subplots() by passing ax=ax, and return the figure.
Checked: the bars and the x label.
Example 1
df {"age":[21,22,22,35,35,35,60]}
bins 3
draws
Constraints
2 <= len(df) <= 60, ages not all equal2 <= bins <= 10
Write it in your browser, against the clock. The model solution, stepped through line by line, comes after.
More seaborn problems
- Table as ColorsBeginner
- A Line per CityEasy
- Bars by Two KeysEasy
- Colored by GroupEasy
- Every Point in Its LaneEasy
- Long Names SidewaysEasy
- Numbers in the CellsEasy
- Tallest FirstEasy