Colored by Group
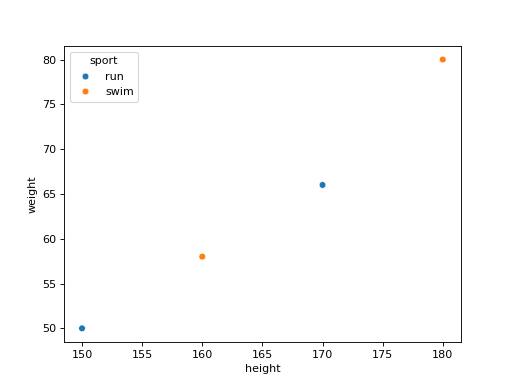
df has columns height, weight and sport. Draw a seaborn scatter plot of weight against height in which the color of each dot shows its sport. seaborn adds the legend. Draw it on a chart made with fig, ax = plt.subplots() by passing ax=ax, and return the figure.
Checked: the points, the legend and the legend title.
Example 1
df {"height":[150,160,170,180],"weight":[50,58,66,80],"sport":["run","swim","run","swim"]}
draws
Constraints
2 <= len(df) <= 40- 2 to 4 sports
Write it in your browser, against the clock. The model solution, stepped through line by line, comes after.