Every Point in Its Lane
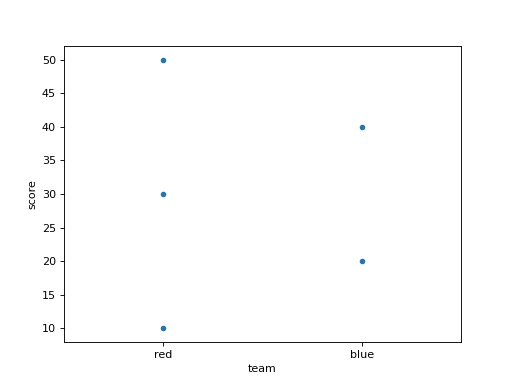
A bar hides how many rows stand behind it. df has columns team and score. Draw every row as a dot with seaborn, the dots of each team stacked in one straight vertical lane above the team's name (no sideways jitter). Draw it on a chart made with fig, ax = plt.subplots() by passing ax=ax, and return the figure.
Checked: the points and the x tick labels.
Example 1
df {"team":["red","blue","red","blue","red"],"score":[10,20,30,40,50]}
draws
Constraints
- 2 to 5 teams,
len(df) <= 60
Write it in your browser, against the clock. The model solution, stepped through line by line, comes after.