Numbers in the Cells
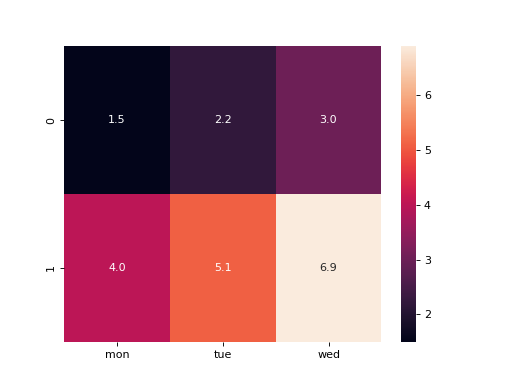
df is a table of numbers with one decimal. Show it as a seaborn heatmap with each number written in its cell, with one decimal. Draw it on a chart made with fig, ax = plt.subplots() by passing ax=ax, and return the figure.
Checked: the grid of values and the texts.
Example 1
df {"mon":[1.5,4],"tue":[2.2,5.1],"wed":[3,6.9]}
draws
Constraints
- 1 to 6 rows, 1 to 5 columns
Write it in your browser, against the clock. The model solution, stepped through line by line, comes after.
More seaborn problems
- Tallest FirstEasy
- Trend Through the DotsEasy
- A Chart per GroupMedium
- A Trend per GroupMedium
- Counts in a Chosen OrderMedium
- How the Columns Move TogetherMedium
- Means Joined by LinesMedium
- Pivot Then ColorMedium