Counts in a Chosen Order
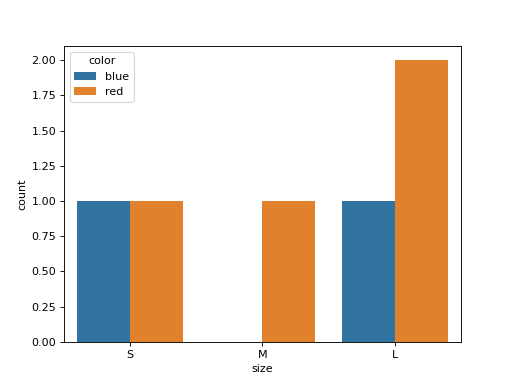
df has columns size (one of "S", "M", "L") and color. Draw a seaborn count plot with the sizes in the order S, M, L whatever order the rows come in, each size split into side by side bars by color, with the colors in alphabetical order. Use an ax you create and return the figure.
Checked: the bars, the x tick labels and the legend.
Example 1
df {"size":["L","S","M","S","L","L"],"color":["red","blue","red","red","blue","red"]}
draws
Constraints
3 <= len(df) <= 60- 2 or 3 colors
Write it in your browser, against the clock. The model solution, stepped through line by line, comes after.
More seaborn problems
- How the Columns Move TogetherMedium
- Means Joined by LinesMedium
- Pivot Then ColorMedium
- Share Below Each ValueMedium
- Stacked ShapesMedium
- The Average LineMedium
- A Histogram per GroupHard
- A Line per PanelHard