A Histogram per Group
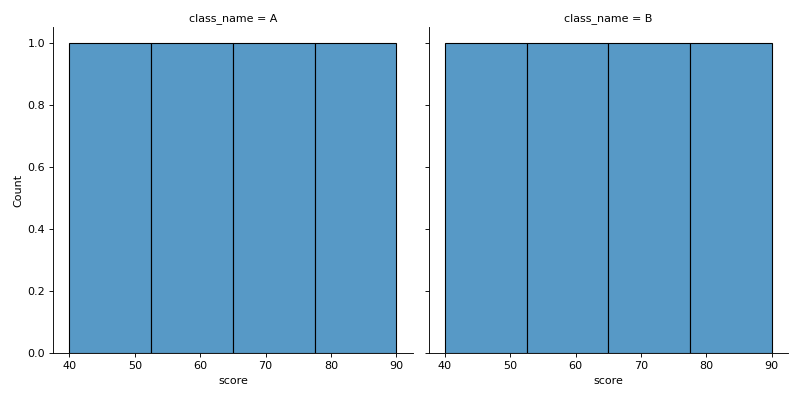
df has columns score and class_name. Use seaborn's displot to draw one histogram of score per class, side by side in one row, all with the same bins bins, so the shapes can be compared directly. The function returns a grid object, not a chart: return its figure.
Checked: the title, where each chart sits and the bars.
Example 1
df {"score":[50,60,70,80,55,65,90,40],"class_name":["A","A","A","A","B","B","B","B"]}
bins 4
draws
Constraints
- 2 to 4 classes,
len(df) <= 60, scores not all equal 2 <= bins <= 8
Write it in your browser, against the clock. The model solution, stepped through line by line, comes after.