Bars per Panel
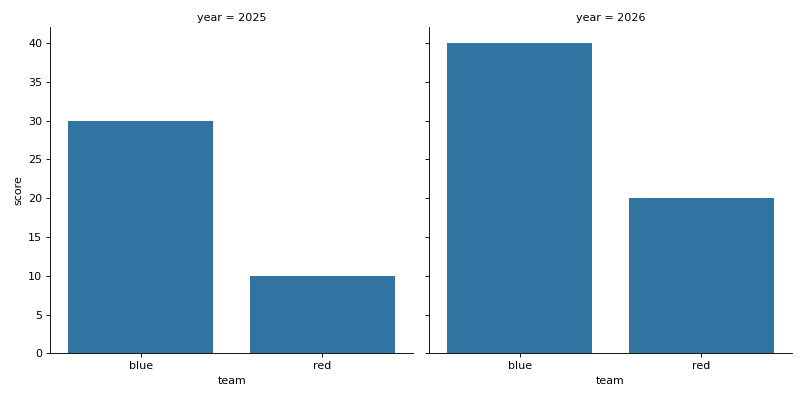
df has columns team, year and score. Use seaborn's catplot to draw the mean score per team as bars, without error bars, in one chart per year side by side. Every chart must show the teams in alphabetical order. The function returns a grid object, not a chart: return its figure.
Checked: the title, where each chart sits, the bars and the x tick labels.
Example 1
df {"team":["red","red","blue","blue"],"year":["2025","2026","2025","2026"],"score":[10,20,30,40]}
draws
Constraints
- 2 to 4 teams, 2 years, every team has rows in both years,
len(df) <= 60
Write it in your browser, against the clock. The model solution, stepped through line by line, comes after.
More seaborn problems
- Bars, Curve and MeanHard
- Dots With MarginsHard
- Every Pair of ColumnsHard
- Months and YearsHard
- A Title for the ChartBeginner
- Average per TeamBeginner
- Boxes per TeamBeginner
- Dots From a TableBeginner