Months and Years
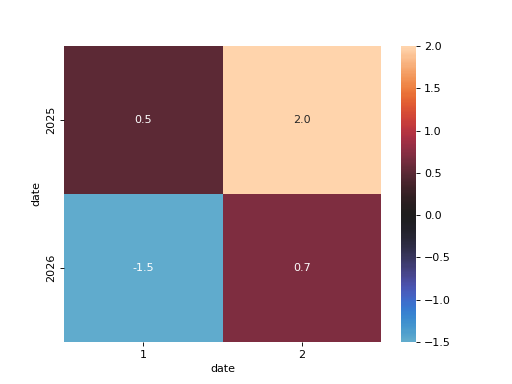
A fund reports daily returns: df has columns date (such as "2025-03-14") and ret (percent, one decimal). Show the total return of every month as a seaborn heatmap with one row per year and one column per month number: add up the returns of each month, write each total in its cell with one decimal, and center the colors on 0 (center=0) so gains and losses get opposite colors. A month without data stays empty. Use an ax you create and return the figure.
Checked: the grid of values, the x tick labels, the y tick labels and the texts.
Example 1
df {"date":["2025-01-10","2025-01-20","2025-02-05","2026-01-15","2026-02-10","2026-02-11"],"ret":[1,-0.5,2,-1.5,0.3,0.4]}
draws
Constraints
- 1 to 3 years,
len(df) <= 80
Write it in your browser, against the clock. The model solution, stepped through line by line, comes after.
More seaborn problems
- A Title for the ChartBeginner
- Average per TeamBeginner
- Boxes per TeamBeginner
- Dots From a TableBeginner
- How Many of EachBeginner
- Line From a TableBeginner
- Shape of a ColumnBeginner
- Table as ColorsBeginner