Bars That Say Their Number
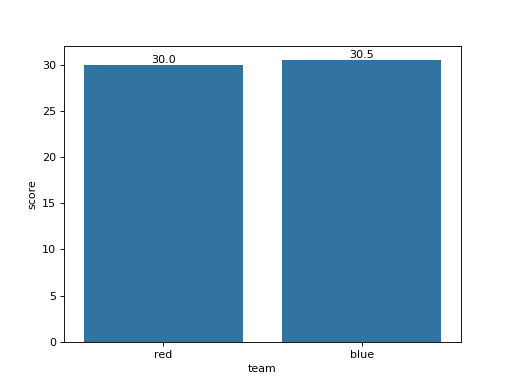
df has columns team and score. Draw a seaborn bar chart of the mean score per team without error bars, and write each bar's value above it with one decimal, using matplotlib's bar_label. Use an ax you create and return the figure.
Checked: the bars, the x tick labels and the texts.
Example 1
df {"team":["red","blue","red","blue","red"],"score":[10,20,30,41,50]}
draws
Constraints
- 2 to 5 teams,
len(df) <= 60 - No mean ends in exactly 5 at the second decimal
Write it in your browser, against the clock. The model solution, stepped through line by line, comes after.
More seaborn problems
- Bars per PanelHard
- Bars, Curve and MeanHard
- Dots With MarginsHard
- Every Pair of ColumnsHard
- Months and YearsHard
- A Title for the ChartBeginner
- Average per TeamBeginner
- Boxes per TeamBeginner