A Line per Panel
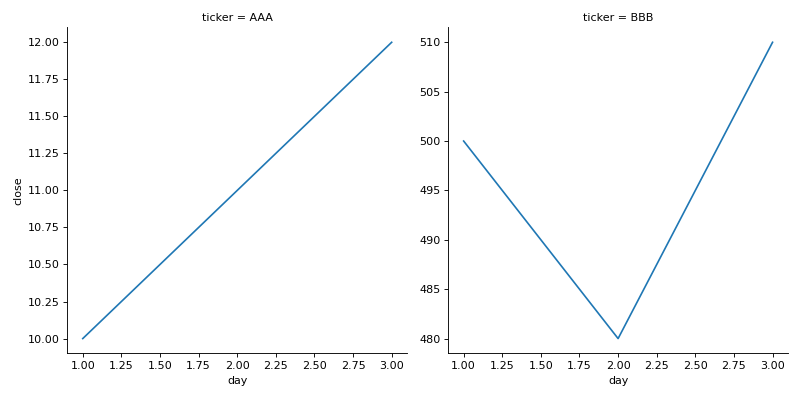
df has columns day, ticker and close, one row per ticker per day. Stocks at very different prices flatten each other on a shared axis. Use seaborn's relplot to draw close against day as a line in a separate chart per ticker, wrapping to a new row after every 2 charts, and let every chart have its own y axis (facet_kws={"sharey": False}). The function returns a grid object, not a chart: return its figure.
Checked: the title, where each chart sits and the lines.
Example 1
df {"day":[1,2,3,1,2,3],"ticker":["AAA","AAA","AAA","BBB","BBB","BBB"],"close":[10,11,12,500,480,510]}
draws
Constraints
- 2 to 5 tickers, 2 to 15 days
Write it in your browser, against the clock. The model solution, stepped through line by line, comes after.
More seaborn problems
- Bars That Say Their NumberHard
- Bars per PanelHard
- Bars, Curve and MeanHard
- Dots With MarginsHard
- Every Pair of ColumnsHard
- Months and YearsHard
- A Title for the ChartBeginner
- Average per TeamBeginner