Stacked Shapes
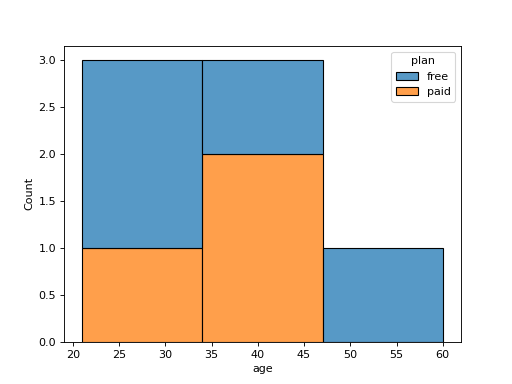
df has columns age and plan (a name). Draw one seaborn histogram of age with bins bins in which each bar is split by plan, the parts stacked on top of each other so the total height still shows the whole count. Use an ax you create and return the figure.
Checked: the bars and the legend.
Example 1
df {"age":[21,22,22,35,35,35,60],"plan":["free","paid","free","free","paid","paid","free"]}
bins 3
draws
Constraints
- 2 or 3 plans,
4 <= len(df) <= 60, ages not all equal 2 <= bins <= 8
Write it in your browser, against the clock. The model solution, stepped through line by line, comes after.