Pivot Then Color
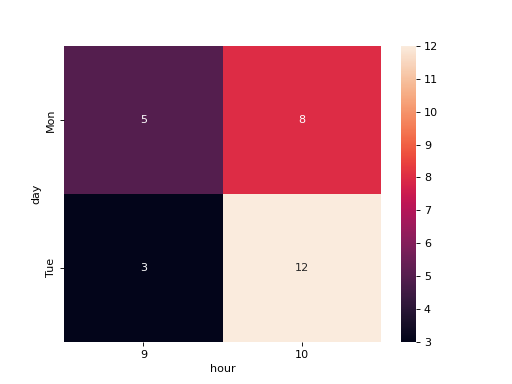
A shop logged its visitors: df has one row per day and hour, with columns day, hour and visits. Reshape it into a table with one row per day and one column per hour, and show that table as a seaborn heatmap with the whole-number visits written in the cells (fmt="d"). Draw on an ax you create and return the figure.
Checked: the grid of values, the x tick labels, the y tick labels and the texts.
Example 1
df {"day":["Mon","Mon","Tue","Tue"],"hour":[9,10,9,10],"visits":[5,8,3,12]}
draws
Constraints
- 2 to 5 days, 2 to 6 hours, every day has every hour
Write it in your browser, against the clock. The model solution, stepped through line by line, comes after.
More seaborn problems
- Share Below Each ValueMedium
- Stacked ShapesMedium
- The Average LineMedium
- A Histogram per GroupHard
- A Line per PanelHard
- Bars That Say Their NumberHard
- Bars per PanelHard
- Bars, Curve and MeanHard