Bars by Two Keys
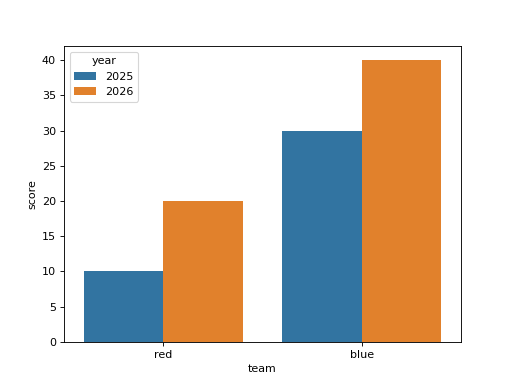
df has columns team, year and score. Draw a seaborn bar chart of the mean score per team, with the bars of each team split by year into side by side bars of different colors, without error bars. Draw it on a chart made with fig, ax = plt.subplots() by passing ax=ax, and return the figure.
Checked: the bars, the x tick labels and the legend.
Example 1
df {"team":["red","red","blue","blue"],"year":["2025","2026","2025","2026"],"score":[10,20,30,40]}
draws
Constraints
- 2 to 4 teams, 2 years, every team has rows in both years
Write it in your browser, against the clock. The model solution, stepped through line by line, comes after.