Two Spreads, Same Bins
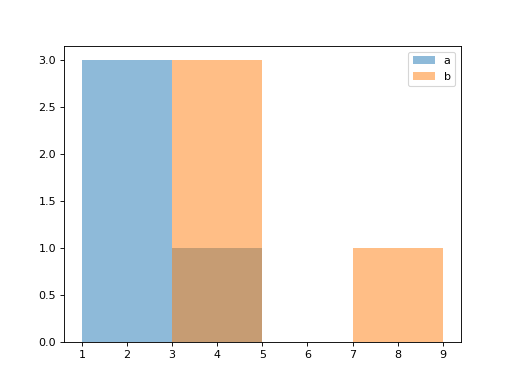
To compare two samples, their histograms must use the same bins. Cut the range from the smallest to the largest value of both samples together into bins equal bins. Draw the histogram of a and then of b with those bins on one chart, each with alpha=0.5 so they show through each other, labeled "a" and "b". Show the legend and return the figure.
Checked: the bars and the legend.
Example 1
a [1,2,2,3]
b [3,4,4,9]
bins 4
draws
Constraints
2 <= len(a), len(b) <= 602 <= bins <= 10- The values are not all equal
Write it in your browser, against the clock. The model solution, stepped through line by line, comes after.