Candles
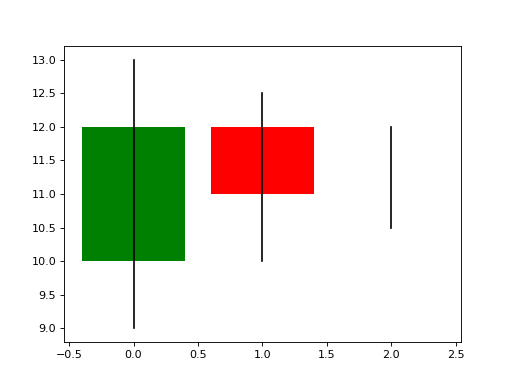
Draw a candlestick chart of a stock. Day i (0, 1, 2, ...) has an open, a close, a high and a low price.
- The wick: a line drawn with
plotfrom(i, low)to(i, high), in"black". - The body: a bar at
ithat spans from the open to the close, so it starts at the smaller of the two and its height is their difference. It is"green"when the close is at or above the open and"red"otherwise.
Draw the wick and then the body of each day, with default bar width. Return the figure.
Checked: the lines, the bars and the bar colors.
Example 1
opens [10,12,11]
closes [12,11,11]
highs [13,12.5,12]
lows [9,10,10.5]
draws
Constraints
1 <= days <= 30low <= open, close <= highon every day
Write it in your browser, against the clock. The model solution, stepped through line by line, comes after.
More matplotlib problems
- Correlation PictureHard
- Four ViewsHard
- LayersHard
- Line Through the DotsHard
- One Small Chart EachHard
- Price and DrawdownHard
- Bar for Each NameBeginner
- DotsBeginner