Correlation Picture
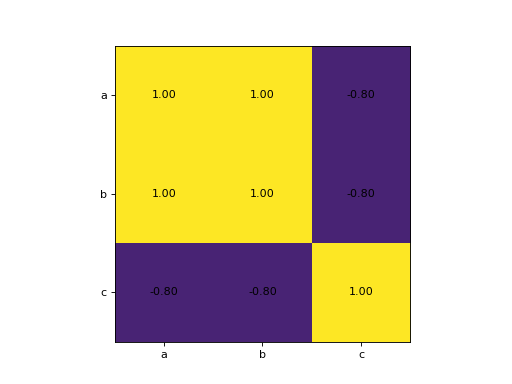
Each column of X is one measurement and names holds the column names. Compute the correlation of every column with every other and show the table as an image with vmin=-1 and vmax=1, so that the colors mean the same in every chart. Put the names on both axes as tick labels at the positions 0, 1, 2, ..., and write each correlation in its cell with 2 decimals. Return the figure.
Checked: the grid of values, the x tick labels, the y tick labels and the texts.
Example 1
X [[1,2,5],[2,4,3],[3,6,4],[4,8,1],[5,10,2]]
names ["a","b","c"]
draws
Constraints
- 2 to 5 columns, 5 to 40 rows
- No column is constant
Write it in your browser, against the clock. The model solution, stepped through line by line, comes after.
More matplotlib problems
- Four ViewsHard
- LayersHard
- Line Through the DotsHard
- One Small Chart EachHard
- Price and DrawdownHard
- Bar for Each NameBeginner
- DotsBeginner
- First LineBeginner