One Small Chart Each
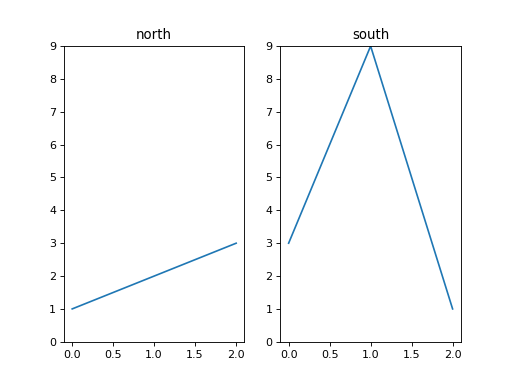
rows holds one series per name. Draw them as small multiples: one row of charts, one chart per name in order, each with its series as a line against the positions 0, 1, 2, ... and its name as the title. So that the charts can be compared at a glance, give every chart the same y limits: from 0 to the largest value found in any of the series. Return the figure.
Checked: the title, where each chart sits, the lines and the y limits.
Example 1
names ["north","south"]
rows [[1,2,3],[3,9,1]]
draws
Constraints
- 2 to 5 names
- Each series has 2 to 20 values, all 0 or more, and some value is above 0
Write it in your browser, against the clock. The model solution, stepped through line by line, comes after.
More matplotlib problems
- Price and DrawdownHard
- Bar for Each NameBeginner
- DotsBeginner
- First LineBeginner
- How the Values SpreadBeginner
- Name the ChartBeginner
- Sideways BarsBeginner
- Slices of the WholeBeginner