How the Values Spread
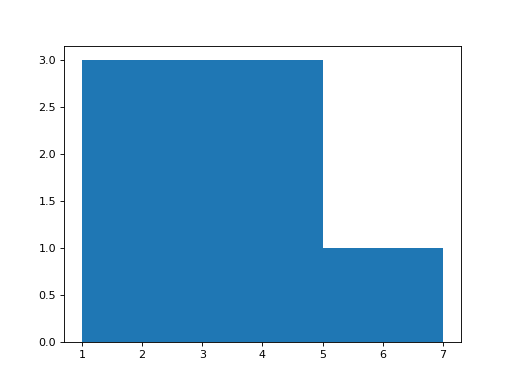
Draw a histogram of values with bins equal-width bins and return the figure. A histogram cuts the range from the smallest to the largest value into bins and draws a bar for how many values fall in each.
Checked: the bars.
Example 1
values [1,2,2,3,3,3,7]
bins 3
draws
Constraints
2 <= len(values) <= 60, not all equal2 <= bins <= 10
Write it in your browser, against the clock. The model solution, stepped through line by line, comes after.
More matplotlib problems
- Name the ChartBeginner
- Sideways BarsBeginner
- Slices of the WholeBeginner
- Two Lines, One ChartBeginner
- Dashed and DottedEasy
- Gains and LossesEasy
- Grid and LegendEasy
- Growth on a Log ScaleEasy