Grid and Legend
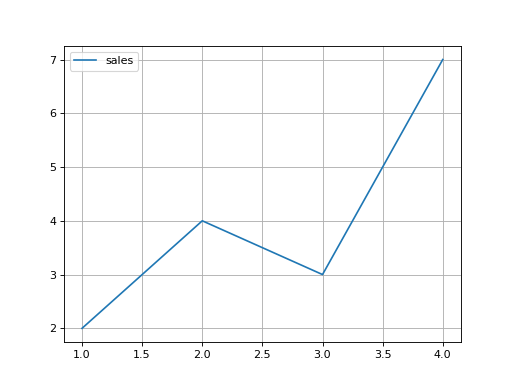
Draw ys against xs as a line labeled name. Turn the grid on so values can be read off, and show the legend. Return the figure.
Checked: the lines with their labels, the legend and the grid.
Example 1
xs [1,2,3,4]
ys [2,4,3,7]
name "sales"
draws
Constraints
2 <= len(xs) == len(ys) <= 30
Write it in your browser, against the clock. The model solution, stepped through line by line, comes after.
More matplotlib problems
- Growth on a Log ScaleEasy
- Label the PeakEasy
- Mark the AverageEasy
- Names on the AxisEasy
- Side by SideEasy
- Zoom InEasy
- Bars in PairsMedium
- Bars on Top of BarsMedium