Bars in Pairs
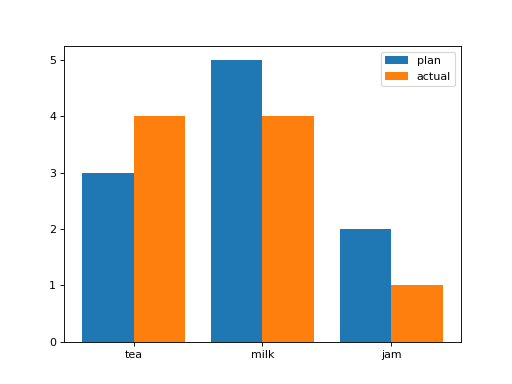
Each name has two values to compare: plan[i] and actual[i]. Draw them as two bars side by side per name. Put name i at position i on the x axis; make every bar 0.4 wide, the plan bar centered at i - 0.2 and the actual bar at i + 0.2. Label the two sets "plan" and "actual", show the legend, and show the names as tick labels at the positions 0, 1, 2, ... Return the figure.
Checked: the bars, the x ticks, the x tick labels and the legend.
Example 1
names ["tea","milk","jam"]
plan [3,5,2]
actual [4,4,1]
draws
Constraints
1 <= len(names) <= 8, all different
Write it in your browser, against the clock. The model solution, stepped through line by line, comes after.
More matplotlib problems
- Bars on Top of BarsMedium
- Boxes for GroupsMedium
- Grid of FourMedium
- Numbers on a HeatmapMedium
- Price and Its AverageMedium
- Shade the RangeMedium
- Two ScalesMedium
- Two Spreads, Same BinsMedium