Price and Its Average
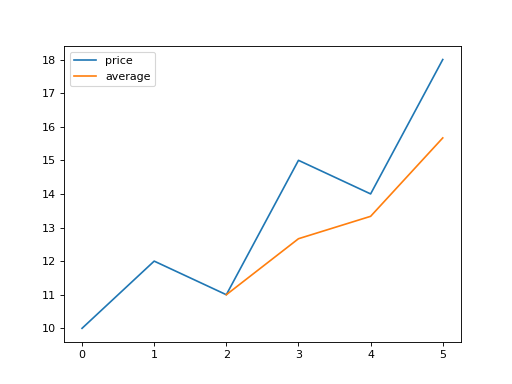
Draw prices as a line against the day numbers 0, 1, 2, ... with the label "price". On the same chart draw its k-day moving average with the label "average": the mean of each k prices in a row, placed at the day of the last of them, so that line starts at day k - 1. Show the legend and return the figure.
Checked: the lines with their labels and the legend.
Example 1
prices [10,12,11,15,14,18]
k 3
draws
Constraints
1 <= k <= len(prices) <= 60
Write it in your browser, against the clock. The model solution, stepped through line by line, comes after.
More matplotlib problems
- Shade the RangeMedium
- Two ScalesMedium
- Two Spreads, Same BinsMedium
- Bell Over the BarsHard
- Biggest First, With a Running ShareHard
- CandlesHard
- Correlation PictureHard
- Four ViewsHard