Biggest First, With a Running Share
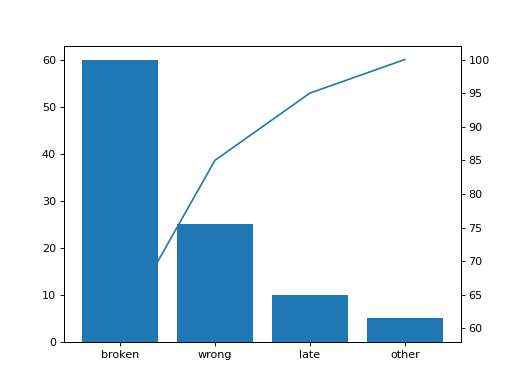
A Pareto chart shows which few causes make up most of a total. Sort the names by value from largest to smallest (the values are all different). Draw a bar chart of the sorted values by name. Then add a second y axis on the right sharing the x axis, and on it draw a line through the positions 0, 1, 2, ... with the running share of the total in percent: after the first bar, after the first two, and so on up to 100. Return the figure.
Checked: the bars, the x tick labels and the lines.
Example 1
names ["late","broken","wrong","other"]
values [10,60,25,5]
draws
Constraints
1 <= len(names) <= 8, all different- The values are positive and all different
Write it in your browser, against the clock. The model solution, stepped through line by line, comes after.
More matplotlib problems
- CandlesHard
- Correlation PictureHard
- Four ViewsHard
- LayersHard
- Line Through the DotsHard
- One Small Chart EachHard
- Price and DrawdownHard
- Bar for Each NameBeginner