Line Through the Dots
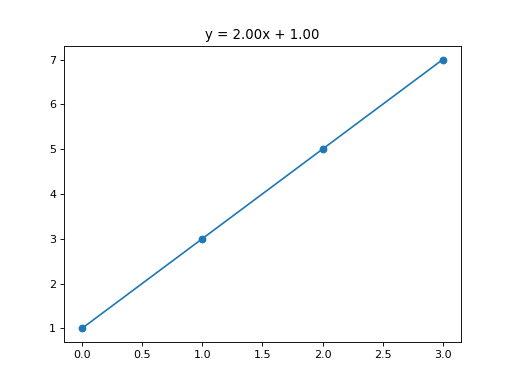
Draw a scatter plot of the points (xs[i], ys[i]). Fit the least squares line y = m * x + c to them and draw it as a line from the smallest x to the largest x (two points are enough). Set the title to the equation with both numbers rounded to 2 decimals, in exactly this form: y = 2.00x + 1.00 (a negative c gives y = 2.00x + -1.00). Return the figure.
Checked: the points, the lines and the title.
Example 1
xs [0,1,2,3]
ys [1,3,5,7]
draws
Constraints
3 <= len(xs) <= 40- The xs are not all equal
Write it in your browser, against the clock. The model solution, stepped through line by line, comes after.
More matplotlib problems
- One Small Chart EachHard
- Price and DrawdownHard
- Bar for Each NameBeginner
- DotsBeginner
- First LineBeginner
- How the Values SpreadBeginner
- Name the ChartBeginner
- Sideways BarsBeginner