Bar for Each Name
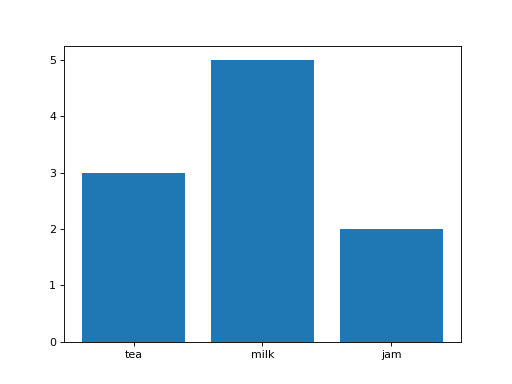
Draw a bar chart with one bar per name: the bar of names[i] is values[i] tall. Return the figure.
Checked: the bars and the x tick labels.
Example 1
names ["tea","milk","jam"]
values [3,5,2]
draws
Constraints
1 <= len(names) == len(values) <= 10- The names are all different
Write it in your browser, against the clock. The model solution, stepped through line by line, comes after.
More matplotlib problems
- DotsBeginner
- First LineBeginner
- How the Values SpreadBeginner
- Name the ChartBeginner
- Sideways BarsBeginner
- Slices of the WholeBeginner
- Two Lines, One ChartBeginner
- Dashed and DottedEasy