Slices of the Whole
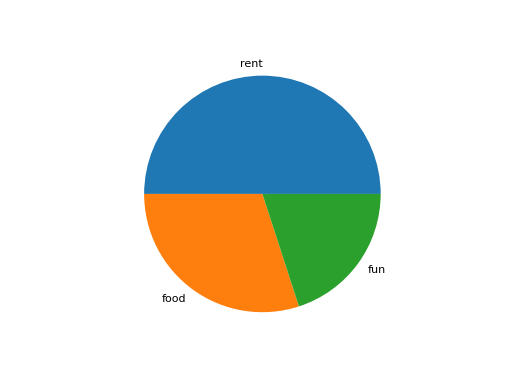
Draw a pie chart in which each name gets a slice in proportion to its size, labeled with the name. Return the figure.
Checked: the wedges and the texts.
Example 1
names ["rent","food","fun"]
sizes [50,30,20]
draws
Constraints
1 <= len(names) == len(sizes) <= 81 <= sizes[i] <= 100
Write it in your browser, against the clock. The model solution, stepped through line by line, comes after.
More matplotlib problems
- Two Lines, One ChartBeginner
- Dashed and DottedEasy
- Gains and LossesEasy
- Grid and LegendEasy
- Growth on a Log ScaleEasy
- Label the PeakEasy
- Mark the AverageEasy
- Names on the AxisEasy