Growth on a Log Scale
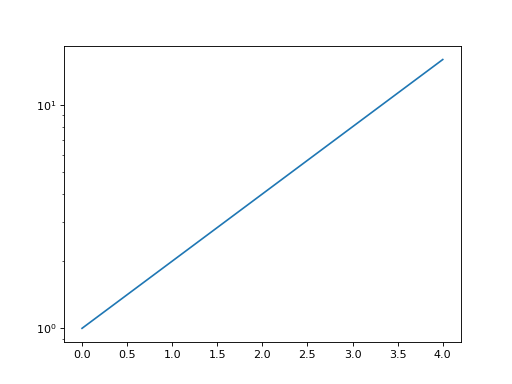
Something that doubles again and again looks like a wall on an ordinary chart. Draw ys against xs as a line with a logarithmic y axis, on which steady growth becomes a straight line. Return the figure.
Checked: the lines and the y scale.
Example 1
xs [0,1,2,3,4]
ys [1,2,4,8,16]
draws
Constraints
2 <= len(xs) == len(ys) <= 30- Every y is positive
Write it in your browser, against the clock. The model solution, stepped through line by line, comes after.
More matplotlib problems
- Label the PeakEasy
- Mark the AverageEasy
- Names on the AxisEasy
- Side by SideEasy
- Zoom InEasy
- Bars in PairsMedium
- Bars on Top of BarsMedium
- Boxes for GroupsMedium