Mark the Average
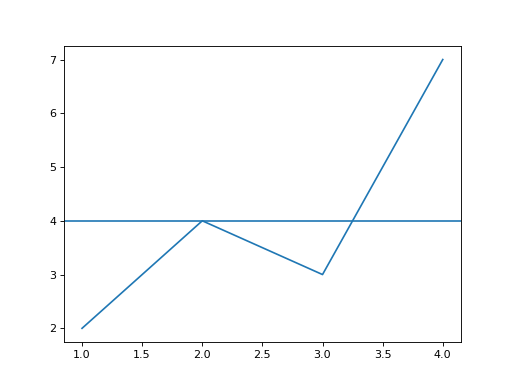
Draw ys against xs as a line, and add a horizontal line across the whole chart at the mean of ys. Return the figure.
Checked: the lines.
Example 1
xs [1,2,3,4]
ys [2,4,3,7]
draws
Constraints
2 <= len(xs) == len(ys) <= 30
Write it in your browser, against the clock. The model solution, stepped through line by line, comes after.
More matplotlib problems
- Names on the AxisEasy
- Side by SideEasy
- Zoom InEasy
- Bars in PairsMedium
- Bars on Top of BarsMedium
- Boxes for GroupsMedium
- Grid of FourMedium
- Numbers on a HeatmapMedium