Grid of Four
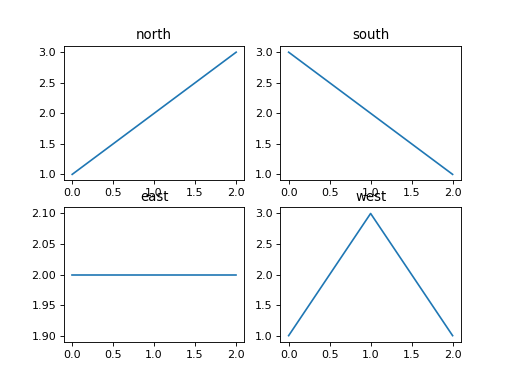
rows holds four series and names their four names. Make a figure with a 2 by 2 grid of charts and draw one series in each, in reading order (top left, top right, bottom left, bottom right), as a line against its positions 0, 1, 2, ... Give each chart its name as the title. Return the figure.
Checked: the lines, the title and where each chart sits.
Example 1
names ["north","south","east","west"]
rows [[1,2,3],[3,2,1],[2,2,2],[1,3,1]]
draws
Constraints
- Each series has 2 to 20 values
Write it in your browser, against the clock. The model solution, stepped through line by line, comes after.
More matplotlib problems
- Numbers on a HeatmapMedium
- Price and Its AverageMedium
- Shade the RangeMedium
- Two ScalesMedium
- Two Spreads, Same BinsMedium
- Bell Over the BarsHard
- Biggest First, With a Running ShareHard
- CandlesHard