Two Scales
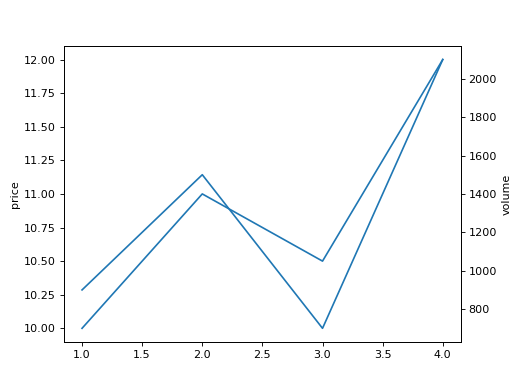
A price in dollars and a volume in thousands cannot share one y axis. Draw price against days as a line with the y label "price". Then add a second y axis on the right that shares the same x axis, and on it draw volume against days with the y label "volume". Return the figure.
Checked: the lines, the y label and where each chart sits.
Example 1
days [1,2,3,4]
price [10,11,10.5,12]
volume [900,1500,700,2100]
draws
Constraints
2 <= len(days) <= 30
Write it in your browser, against the clock. The model solution, stepped through line by line, comes after.