Four Views
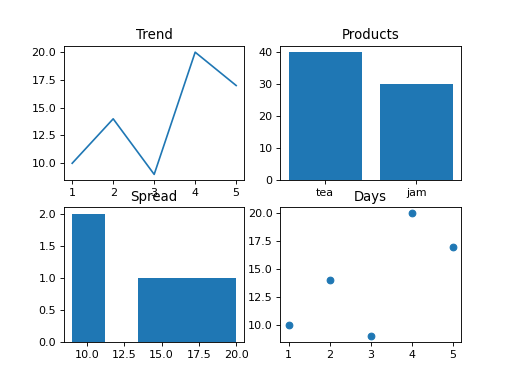
Build a small dashboard: a 2 by 2 grid of charts, each with a title.
- Top left,
"Trend":salesagainstdaysas a line. - Top right,
"Products": a bar chart oftotalsbynames. - Bottom left,
"Spread": a histogram ofsaleswith 5 bins. - Bottom right,
"Days": a scatter plot ofsalesagainstdays.
Return the figure.
Checked: the title, where each chart sits, the lines, the bars and the points.
Example 1
days [1,2,3,4,5]
sales [10,14,9,20,17]
names ["tea","jam"]
totals [40,30]
draws
Constraints
2 <= len(days) == len(sales) <= 40, sales not all equal1 <= len(names) == len(totals) <= 6
Write it in your browser, against the clock. The model solution, stepped through line by line, comes after.
More matplotlib problems
- LayersHard
- Line Through the DotsHard
- One Small Chart EachHard
- Price and DrawdownHard
- Bar for Each NameBeginner
- DotsBeginner
- First LineBeginner
- How the Values SpreadBeginner