Price and Drawdown
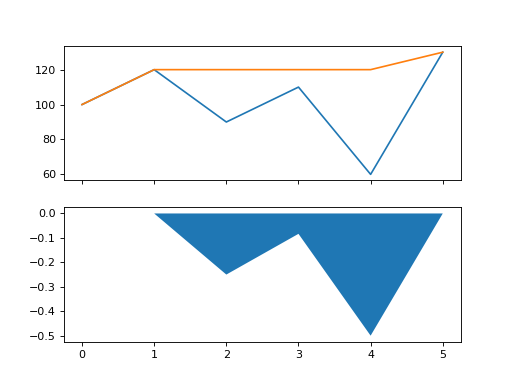
Make a figure with two charts, one above the other, sharing the x axis. Day numbers are 0, 1, 2, ...
- Top:
pricesas a line, and then a second line with the highest price so far on each day. - Bottom: the drawdown on each day,
price / highest so far - 1(0 at a new high, negative below it), drawn as an area filled between the drawdown and 0 withfill_between.
Return the figure.
Checked: where each chart sits, the lines and the filled areas.
Example 1
prices [100,120,90,110,60,130]
draws
Constraints
2 <= len(prices) <= 60- Every price is positive
Write it in your browser, against the clock. The model solution, stepped through line by line, comes after.
More matplotlib problems
- Bar for Each NameBeginner
- DotsBeginner
- First LineBeginner
- How the Values SpreadBeginner
- Name the ChartBeginner
- Sideways BarsBeginner
- Slices of the WholeBeginner
- Two Lines, One ChartBeginner