Dots
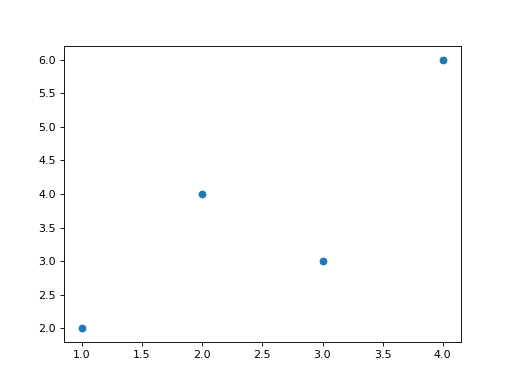
Draw a scatter plot with one dot at each point (xs[i], ys[i]) and return the figure.
Checked: the points.
Example 1
xs [1,2,3,4]
ys [2,4,3,6]
draws
Constraints
1 <= len(xs) == len(ys) <= 40
Write it in your browser, against the clock. The model solution, stepped through line by line, comes after.
More matplotlib problems
- First LineBeginner
- How the Values SpreadBeginner
- Name the ChartBeginner
- Sideways BarsBeginner
- Slices of the WholeBeginner
- Two Lines, One ChartBeginner
- Dashed and DottedEasy
- Gains and LossesEasy