Name the Chart
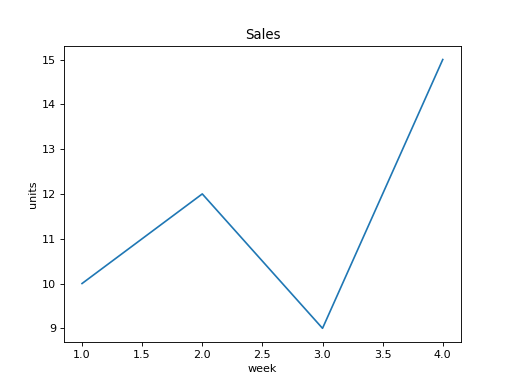
Draw a line chart of ys against xs, give it the title title, label the x axis xlabel and the y axis ylabel, and return the figure.
Checked: the lines, the title, the x label and the y label.
Example 1
xs [1,2,3,4]
ys [10,12,9,15]
title "Sales"
xlabel "week"
ylabel "units"
draws
Constraints
2 <= len(xs) == len(ys) <= 30
Write it in your browser, against the clock. The model solution, stepped through line by line, comes after.
More matplotlib problems
- Sideways BarsBeginner
- Slices of the WholeBeginner
- Two Lines, One ChartBeginner
- Dashed and DottedEasy
- Gains and LossesEasy
- Grid and LegendEasy
- Growth on a Log ScaleEasy
- Label the PeakEasy