Dashed and Dotted
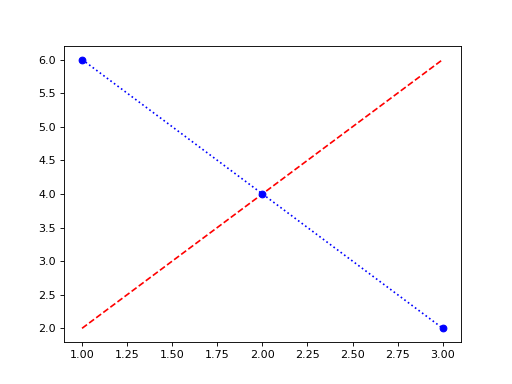
Draw a and b against xs on one chart, a first: a as a red dashed line, and b as a blue dotted line with a circle marker at each point. Return the figure.
Checked: the lines and the style and color of each line.
Example 1
xs [1,2,3]
a [2,4,6]
b [6,4,2]
draws
Constraints
2 <= len(xs) <= 30
Write it in your browser, against the clock. The model solution, stepped through line by line, comes after.
More matplotlib problems
- Gains and LossesEasy
- Grid and LegendEasy
- Growth on a Log ScaleEasy
- Label the PeakEasy
- Mark the AverageEasy
- Names on the AxisEasy
- Side by SideEasy
- Zoom InEasy