Layers
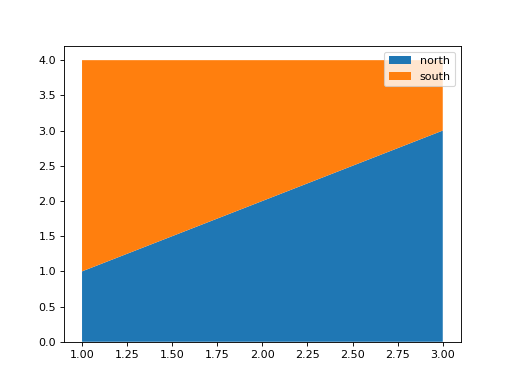
rows holds one series per name, all measured at the same xs. Draw them as a stacked area chart: the first series as an area standing on 0, each next one as an area on top of the ones before, so that the top edge shows the total. Label each area with its name and show the legend. Return the figure.
Checked: the filled areas and the legend.
Example 1
xs [1,2,3]
rows [[1,2,3],[3,2,1]]
names ["north","south"]
draws
Constraints
- 2 to 5 names
2 <= len(xs) <= 20- The values are 0 or more
Write it in your browser, against the clock. The model solution, stepped through line by line, comes after.
More matplotlib problems
- Line Through the DotsHard
- One Small Chart EachHard
- Price and DrawdownHard
- Bar for Each NameBeginner
- DotsBeginner
- First LineBeginner
- How the Values SpreadBeginner
- Name the ChartBeginner