Bell Over the Bars
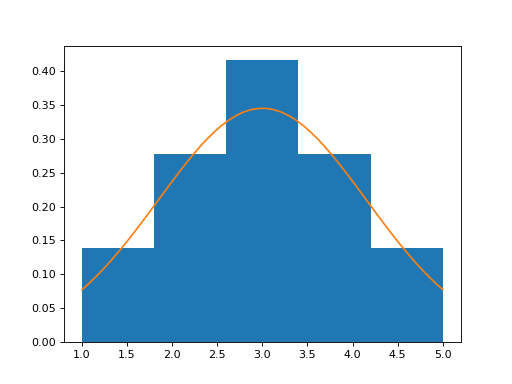
Does a sample look normal? Draw a histogram of values with bins bins, scaled as a density (density=True, so the bars have a total area of 1). Over it draw the normal curve with the sample's mean and standard deviation (the one that divides by n): its height at x is exp(-(x - mean)2 / (2 * sd2)) / (sd * sqrt(2 * pi)). Draw the curve at 50 evenly spaced x values from the smallest value to the largest. Return the figure.
Checked: the bars and the lines.
Example 1
values [1,2,2,3,3,3,4,4,5]
bins 5
draws
Constraints
5 <= len(values) <= 80, not all equal3 <= bins <= 12
Write it in your browser, against the clock. The model solution, stepped through line by line, comes after.