Shade the Range
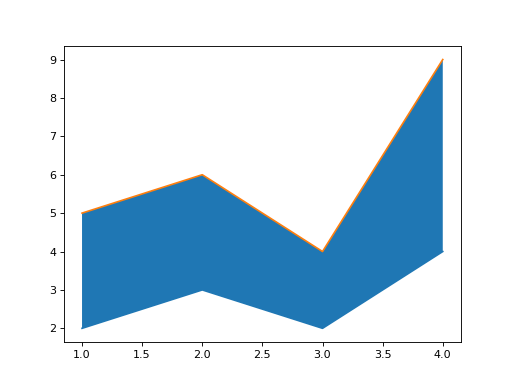
A forecast comes with a low and a high estimate. Draw low and high against xs as two lines, low first, and shade the area between them with fill_between. Return the figure.
Checked: the lines and the filled areas.
Example 1
xs [1,2,3,4]
low [2,3,2,4]
high [5,6,4,9]
draws
Constraints
2 <= len(xs) <= 30low[i] <= high[i]
Write it in your browser, against the clock. The model solution, stepped through line by line, comes after.
More matplotlib problems
- Two ScalesMedium
- Two Spreads, Same BinsMedium
- Bell Over the BarsHard
- Biggest First, With a Running ShareHard
- CandlesHard
- Correlation PictureHard
- Four ViewsHard
- LayersHard